Introduction
At a Glance
What is Mean Time to Repair (MTTR)? MTTR measures the average downtime from when a failure is detected to when equipment returns to full production. The standardized formula is Total Repair Time ÷ Number of Repairs over a defined period. Only 30–40% of total MTTR is hands-on repair work. The remaining 60–70% is organizational delay involving detection, response, diagnosis, and verification. This means most downtime is addressable through process and systems improvements, not just technician skill.
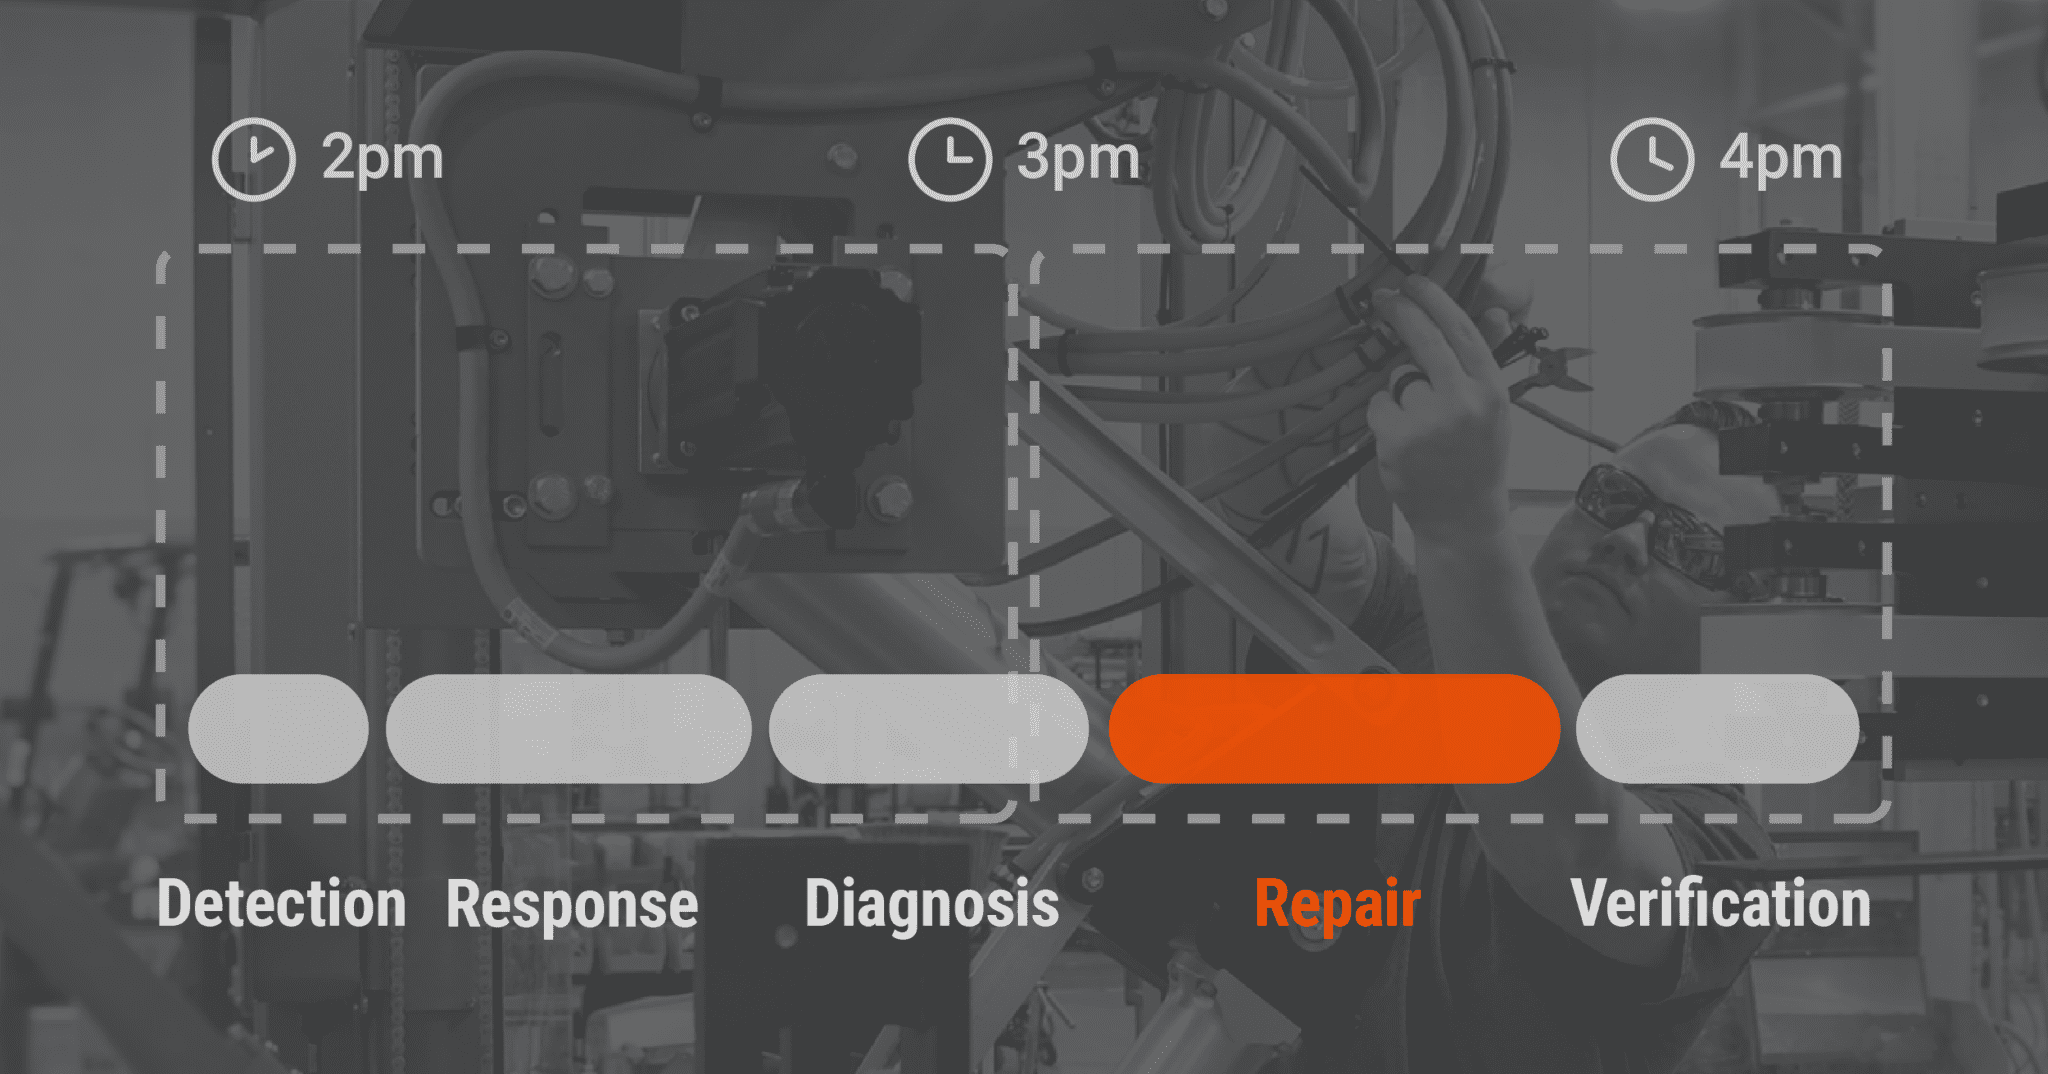
A cartoner jams at 2 p.m. on Tuesday. An operator calls maintenance, but the technician is on another job, so there’s a 30-minute wait before she can get to the line. When she arrives, she spends 45 minutes troubleshooting. The jam isn’t obvious; it could be the infeed or the case handling. Once she finds it (infeed sensor), she needs a replacement, which is in stock but takes 20 minutes to swap and test. By 4 p.m., the line is running again. Total downtime: 2 hours.
We measure repair-process performance using a metric called MTTR, which stands for Mean Time to Repair. It’s not just “how fast can our technician fix it?” It’s “how long does the whole process take from the moment we know something’s broken until the equipment is back running full speed?” Understanding what MTTR measures, where the time actually goes, and how to reduce it is one of the clearest levers for improving availability and production yield.
In this article, we’ll cover:
- MTTR definition and the 30–40% active-repair insight
- Five phases of the repair cycle (and where organizational delays hide)
- How MTTR connects to availability and your bottom line
- The main drivers keeping MTTR long
- Priority sequence for reducing MTTR (detection first)
- When MTTR optimization is the wrong business move
What MTTR Actually Measures
MTTR stands for Mean Time to Repair, and it’s a standardized metric from the Society for Maintenance & Reliability Professionals (SMRP).
The formula is as follows:
MTTR = Total Repair Time ÷ Number of Repairs (over a defined period)
The key word is total. This isn’t the time the technician spends turning a wrench. It’s the cumulative downtime from the moment a failure is detected to the moment the equipment is fully restarted and back at full production speed. If your case packer fails at 2 p.m. and is fully operational again at 4 p.m., that’s a 2-hour MTTR for that incident, regardless of how much of that time was actual hands-on work versus waiting, diagnosing, or testing.
The research on equipment maintenance shows a striking pattern: active repair time on complex equipment typically accounts for only 30–40% of total MTTR. The remaining 60–70% is organizational, involving the detection delay, response delay, diagnosis time, and verification testing. For a manager, this is motivating news. Most downtime isn’t a speed problem. It’s a systems problem that management can directly address.
The Five Phases of Repair Time
To understand where your MTTR actually goes, it helps to break it into five distinct phases. Each has different drivers, and each has different improvement tactics.
1
Detection (Failure to Discovery)
The clock on MTTR starts when the failure is detected, not when it occurs. On a manual-monitoring system, a technician might walk the floor every 2 hours. That means if a bearing starts smoking, no one knows until the next walk-through. That’s up to 2 hours of undetected downtime before the repair process even begins.
Automated monitoring eliminates this gap fast. Real-time sensors on vibration, temperature, or pressure can trigger an alarm the instant a parameter goes out of range, sometimes just seconds after failure. Facilities using IoT-enabled condition monitoring report 40–60% MTTR reductions through faster failure detection alone.
2
Response (Discovery to Technician Arrival)
Once a failure is detected, how long until a qualified technician shows up? If your maintenance team is on-site during production hours, response time might be 5–15 minutes. If you’re calling an OEM field-service technician from three states away, response time can be 4–8 hours or more.
Facilities with on-site or on-call maintenance staff reduce response delays from hours to minutes. This is particularly effective when your facility runs high-frequency failure modes that a local technician can handle without waiting for OEM specialist support.
Remote diagnostics adds a layer here. OEM or third-party service providers using telematics can see equipment health in real time, begin troubleshooting before a technician even arrives, and stage the right parts and tools in advance. These implementations report up to 40% MTTR reduction with ROI typically achieved within 6–12 months through reduced field-service costs and improved availability.
3
Diagnosis (Root-Cause Identification)
Once the technician is on-site, how long does it take to figure out what’s actually broken? For a jammed infeed, a trained technician might spot it in 5 minutes. For a control-system failure with no obvious symptoms, diagnosis can stretch hours.
Diagnosis time is often a significant bottleneck on complex equipment, and the variation is wide. The time depends heavily on whether equipment documentation is current and accessible, whether technicians are trained on the specific machine, and whether the failure pattern has been encountered before.
Clear, accessible maintenance documentation and step-by-step troubleshooting guides are high-leverage. When maintenance manuals, electrical schematics, spare-parts lists, and control-system diagrams are current and on hand, diagnosis time collapses. Add training and cross-training on the specific equipment, and your maintenance team can identify root causes without waiting for OEM support.
4
Repair (Hands-On Fix)
Now the technician knows what’s broken and can actually fix it. For a bearing replacement, this might be 30 minutes. For a complete servo-drive swap, an hour or more.
Active repair is typically only 30–40% of total MTTR. On complex equipment in real facilities, even a 2-hour repair job might be embedded in a 6-hour MTTR because of the other phases eating time. That critical realization can change how you think about downtime.
5
Verification and Restart (Testing and Return to Production)
The technician has replaced the failed component, but the equipment isn’t back in production yet. It needs testing to confirm the repair worked, safety sign-offs, and a controlled restart. This phase includes automated diagnostics, manual testing, operator sign-off, and gradual speed ramp-up to full throughput.
In some cases, verification is quick, totaling a minute or two of startup testing. In others, especially when restart procedures are unclear or safety documentation is missing, verification can stretch into 30+ minutes of trial-and-error.
How MTTR Drives Availability and Why It Matters to Your Bottom Line
MTTR doesn’t matter in isolation. What matters is availability—the percentage of time your equipment is actually ready to run. MTTR drives availability directly through this formula (note, MTBF stands for Mean Time Between Failures or how long the equipment runs without breaking):
Availability = MTBF ÷ (MTBF + MTTR)
Let’s work through an example. Say your case packer has an MTBF of 200 hours and an MTTR of 4 hours. Later, you’re able to cut your MTTR in half, from 4 hours to 2 hours. The formula for those scenarios would look like this:
200-hour MTBF + 4-hour MTTR
Availability
= 200 ÷ (200 + 4)
= 200 ÷ 204
= 98.0%
200-hour MTBF + 2-hour MTTR
Availability
= 200 ÷ (200 + 2)
= 200 ÷ 202
= 99.0%
That 1% improvement in availability doesn’t sound like much until you translate it to production. A 1% availability gain on a 24-hour operation running 300+ days a year is 72+ additional hours of production per year. For high-speed packaging equipment, that’s often worth hundreds of thousands of dollars in recovered production.
Availability feeds directly into Overall Equipment Effectiveness (OEE), which is the metric that tells you what percentage of your theoretical maximum output you’re actually achieving.
OEE = Availability × Performance × Quality.
Availability is often the weakest of the three components, which means MTTR improvements are often the highest-impact lever you have for lifting OEE.
Why Does MTTR Get Long? (The Main Drivers)
To reduce MTTR, you need to understand what’s making it high in the first place. The research points to consistent patterns:
Equipment complexity and poor documentation → Machines with complex designs, proprietary controls, or insufficient technical documentation force technicians into trial-and-error troubleshooting. When manuals or schematics are missing or outdated, diagnosis stretches.
Scarcity of spare parts → Research indicates that nearly half of all unexpected downtimes are attributable to inadequate spare-part availability. Technicians often spend 10–25% of their time hunting for elusive parts, waiting on OEMs, distributors, or special-order suppliers.
Lack of trained on-site technicians → Facilities without adequate maintenance staffing or with technicians unfamiliar with specific equipment must wait for specialist help such as OEM field service or regional contractors. Travel time and dispatch delays compound detection and response.
Off-shift and weekend failures → Failures during night shifts, weekends, or holidays face longer response times when on-site technical coverage is limited or when remote diagnostics and work approval aren’t in place.
Cascading failures → An initial failure (a bearing jam) that isn’t addressed quickly can damage adjacent components like motors, drive systems, or gearboxes. As the scope of the repair expands, MTTR grows substantially.
Priority Sequence for Reducing MTTR
Not all MTTR-reduction tactics have equal impact or equal cost. Here’s where to focus, in priority order based on effectiveness and ROI.
Priority 1: Improve Detection and Response
Priority 2: Improve Diagnosis
Once you’ve cut detection and response delays, diagnosis is the next leverage point.
Priority 3: Improve Repair Time
Priority 4: Improve Verification and Restart
Pro Tip
If MTTR is your constraint, priorities 1–2 are the best place to start because they produce the fastest wins and lowest cost.
When MTTR Optimization Is the Wrong Move
Here’s the vendor-voice guardrail: MTTR optimization isn’t always the right business decision. Here are three scenarios to watch.
If your equipment fails every 4 hours and you spend $100,000 to cut MTTR from 6 hours to 4 hours, you’ve optimized the wrong metric. You’re still losing the same amount of production because the machine still fails every 4 hours. In this case, improving MTBF (the reliability of the equipment) is a better ROI than improving MTTR, either through design changes, preventive maintenance, or equipment replacement.
The first 50% reduction in MTTR (from 8 hours to 4 hours) might cost $50,000 through better documentation, training, and parts kits. The next 25% reduction (from 4 hours to 3 hours) might cost $75,000 because you’re adding sophisticated remote diagnostics and on-site spare-parts inventory. At some point, the business case breaks because the investment to save one more hour of downtime per year doesn’t justify the cost.
For critical operations, having a backup cartoner or palletizer might be a better risk-mitigation strategy than racing to repair the primary equipment. Redundancy will incur cost upfront, but it will eliminate the downtime risk entirely. In other words, sometimes the best MTTR is not repairing at all because the backup unit is already running.
Conclusion
MTTR is the right framework for thinking about repair speed. The five-phase breakdown—detection, response, diagnosis, repair, and verification—helps you identify where time actually goes, and the priority sequence gives you a roadmap. For the best approach, start with improving detection and response (priority 1), then move to improving diagnosis, repair, and verification.
Remember, the question to ask isn’t, “How fast can our technician fix this?” It’s “Where does our repair process lose the most time, and what’s the business case for fixing it first?” Shifting your perspective from technician speed to system improvements can set you on a more effective path to reducing downtime and increasing productivity.
Need to Drive Down MTTF?
Give us a call. With 60+ years of experience, Douglas specialists are ready to help identify improvements and guide you to the fastest payback.