Introduction
If you’ve owned secondary packaging equipment long enough, you’ve learned a hard truth: the purchase price barely shows up in the rear-view mirror. Total Cost of Ownership (TCO) is driven by decisions made long before steel hits the floor—and paid for quietly, shift after shift, for years.
This article ranks the real-world drivers of secondary packaging TCO by impact, based on operational experience across food, beverage, personal care, and household goods manufacturing. More importantly, it shows where TCO is actually created—so you know where to spend time, where to push vendors, and where cutting corners will cost you later.
It reflects what shows up on the plant floor, in OEE reports, in maintenance backlogs, and in unplanned capital requests—not what looks neat in a vendor proposal.
Assumptions Behind This Ranking
This ranking assumes:
If you’re running low-volume, single-SKU lines with minimal integration, some of these drivers may carry less weight. But for most modern CPG operations, the patterns below are remarkably consistent.
1. Requirements Definition Quality (URS / RFS Discipline)
IMPACT: Very high
Often underestimated because: It feels like “paperwork,” not performance.
The single biggest driver of long-term TCO is how well requirements are defined before vendors are engaged.
Weak requirements don’t fail at startup—they fail slowly, through:
Common gaps include:
What “good” looks like isn’t a perfect document—it’s explicit assumptions. When requirements force alignment on variability, ownership, and success criteria, long-term cost stops creeping in unnoticed.
TCO Reality:
A rushed or underpowered URS doesn’t save money—it locks in inefficiency for the life of the asset.
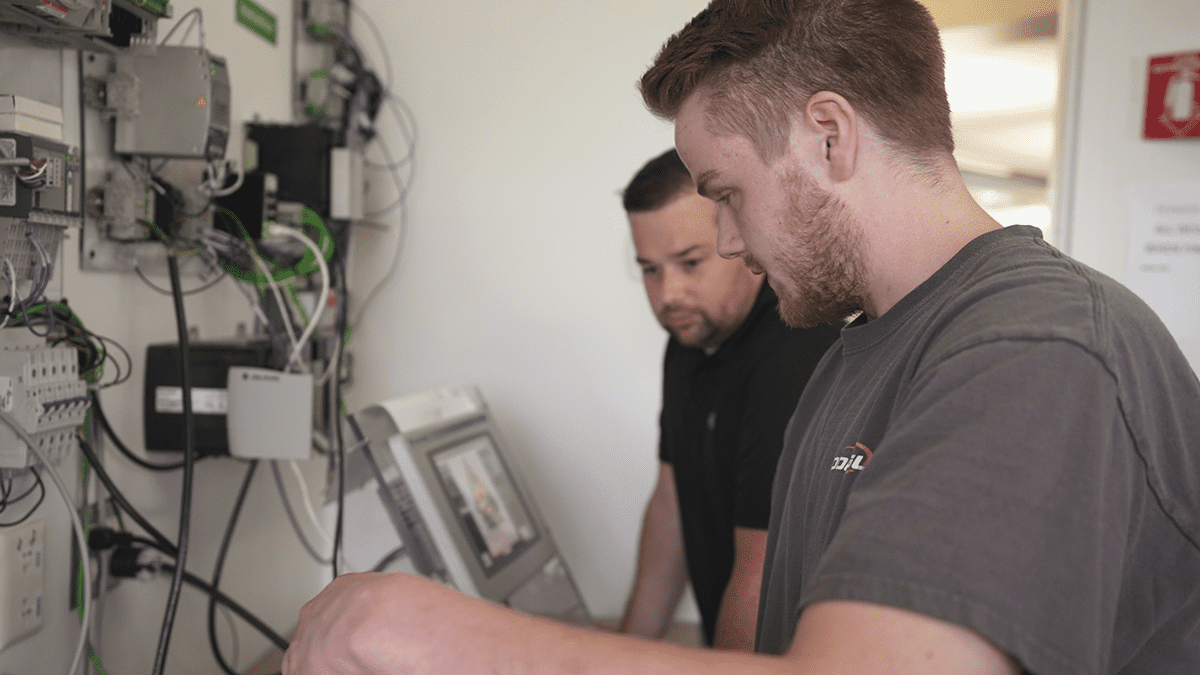
2. System Integration & Line Ownership Clarity
IMPACT: Very high
Often underestimated because: Responsibility is fragmented across vendors.
Secondary packaging rarely fails as a machine. It fails as a system.
TCO explodes when:
Integration decisions directly affect:
A machine that “works in isolation” but degrades line performance is one of the most expensive outcomes you can buy.
TCO Reality:
Integration failures don’t show up as capital overruns—they show up as permanent OEE loss.
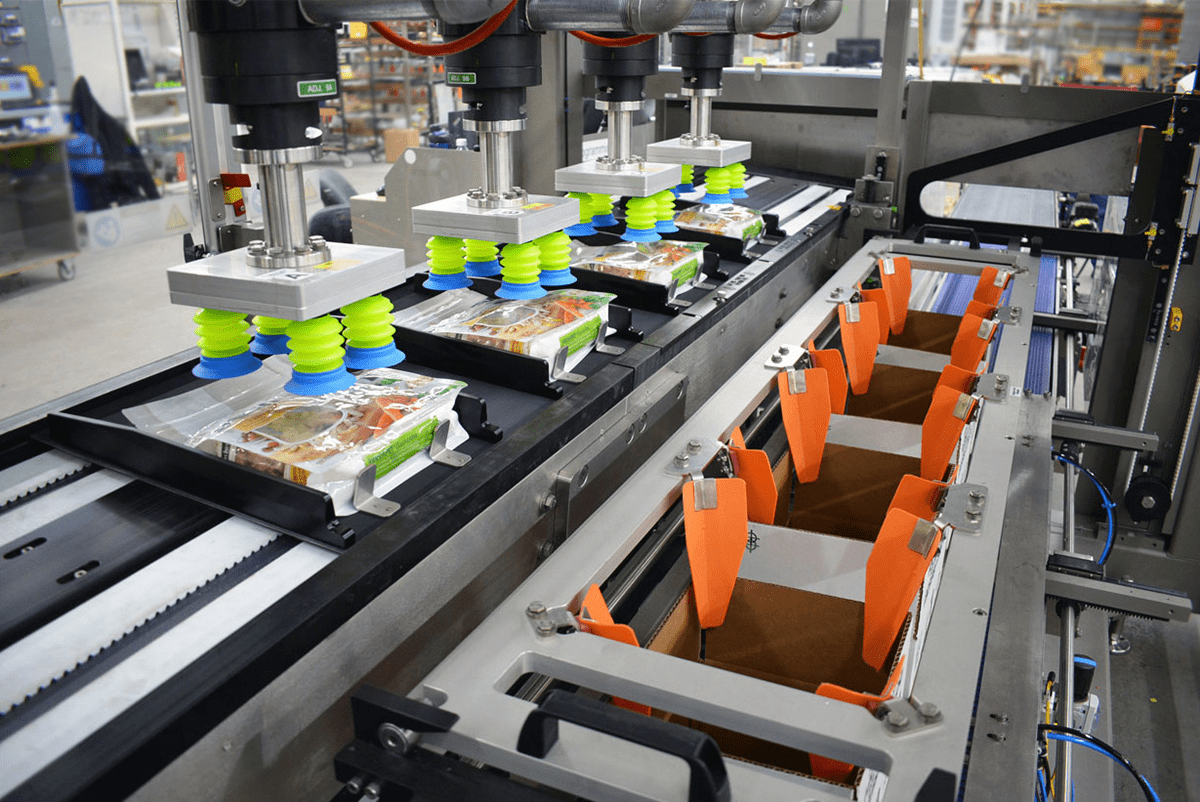
3. Changeover Complexity (Design + Process + Human Factors)
IMPACT: high
Often underestimated because: Changeover time is “planned downtime.”
In high-SKU environments, changeover design is one of the fastest ways to bleed margin.
True changeover cost includes:
Even small inefficiencies compound:
That loss shows up as labor pressure, overtime, missed production windows, and capital justification for equipment you already own.
TCO Reality:
If your changeover depends on “the one operator who knows it,” your TCO is already compromised.
4. Reliability Engineering & Component Choices
IMPACT: high
Often underestimated because: All vendors quote MTBF numbers.
Reliability isn’t about whether a component can work. It’s about whether it will work predictably in your environment.
Key drivers include:
The cheapest component on day one is often the most expensive over ten years.
TCO Reality:
Reliability problems rarely cause catastrophic failures—they cause constant small interruptions that quietly destroy OEE.
5. Operator & Maintenance Usability (Human-Centered Design)
IMPACT: medium-high
Often underestimated because: “Our operators will figure it out.”
Equipment that is hard to operate or maintain silently taxes your organization through:
Usability gaps show up as:
These issues don’t just affect efficiency—they increase safety risk and normalize unsafe behavior over time.
TCO Reality:
If your equipment fights your people, your people will eventually fight back by resorting to workarounds.
6. Spare Parts Strategy & Vendor Dependency
IMPACT: medium
Often underestimated because: It’s a post-purchase problem.
Hidden costs emerge when:
Plants pay for this through excess inventory, emergency freight, extended downtime, and reactive maintenance behavior—often years after the buying decision.
TCO Reality:
Vendor lock-in may simplify purchasing, but often complicates uptime.
7. Service Model & Support Reality (Not the Brochure)
IMPACT: medium
Often underestimated because: Response times are assumed, not validated.
What actually matters:
Service quality doesn’t matter—until it matters a lot.
TCO Reality:
When uptime is on the line, service responsiveness becomes a financial variable, not a relationship issue.
8. Energy, Utilities, and Consumables
IMPACT: low-medium
Often overemphasized in early TCO models.
Utilities and consumables do matter, but they are rarely the primary cost drivers unless:
These costs are usually dwarfted by labor inefficiency and downtime losses.
TCO Reality:
Optimizing utilities while ignoring uptime is solving the wrong problem.
9. Purchase Price
IMPACT: low
Often overemphasized because: It’s visible and easy to compare.
Purchase price still matters, but it matters far less than most teams assume over a 7-15 year lifecycle.
Low capex often correlates with:
TCO Reality:
A cheaper machine that underperforms is not cheaper—it’s just easier to approve.
What This Ranking Should Change in Your Decision Process
If you’re evaluating secondary packaging equipment, TCO thinking should shift your focus:
Industry guidance from organizations like PMMI consistently reinforces this reality: most long-term performance issues are designed in early—not caused later by operations or maintenance.
Final Thought: What to Do With This
Secondary packaging TCO isn’t driven by what you buy. It’s driven by what you assume, what you fail to define, and what you tolerate as “normal” once the line is running.
If your name is attached to uptime, OEE, and capital spend, the safest investment is not the lowest price—it’s the one that reduces ambiguity, aligns ownership, and performs predictably long after commissioning banners come down.
Your Next Step
Before engaging vendors or approving capital, pressure-test your current requirements, integration ownership model, and changeover assumptions against the drivers above. That exercise alone often reveals more cost risk than any proposal comparison ever will.