Introduction
At a Glance
In this article, we’ll cover:
- What vertical startup is and how it differs from simply “going live”
- Why the difference matters financially and operationally
- The five pre-startup readiness factors that drive vertical startup outcomes
- How vertical startup is measured and what the metrics mean
- Vertical startup as an emerging contractual best practice
Vertical startup and going live are fundamentally different outcomes. “Going live” is the event when equipment is installed, utilities are connected, and the first products roll off. Depending on how you approach and plan for this event, you can have very different outcomes. Achieving ‘vertical startup’ is where the equipment reaches nameplate throughput and stable quality within days (vs weeks or months) of installation. It’s the ideal scenario when going live, but achieving it takes careful planning and consideration.
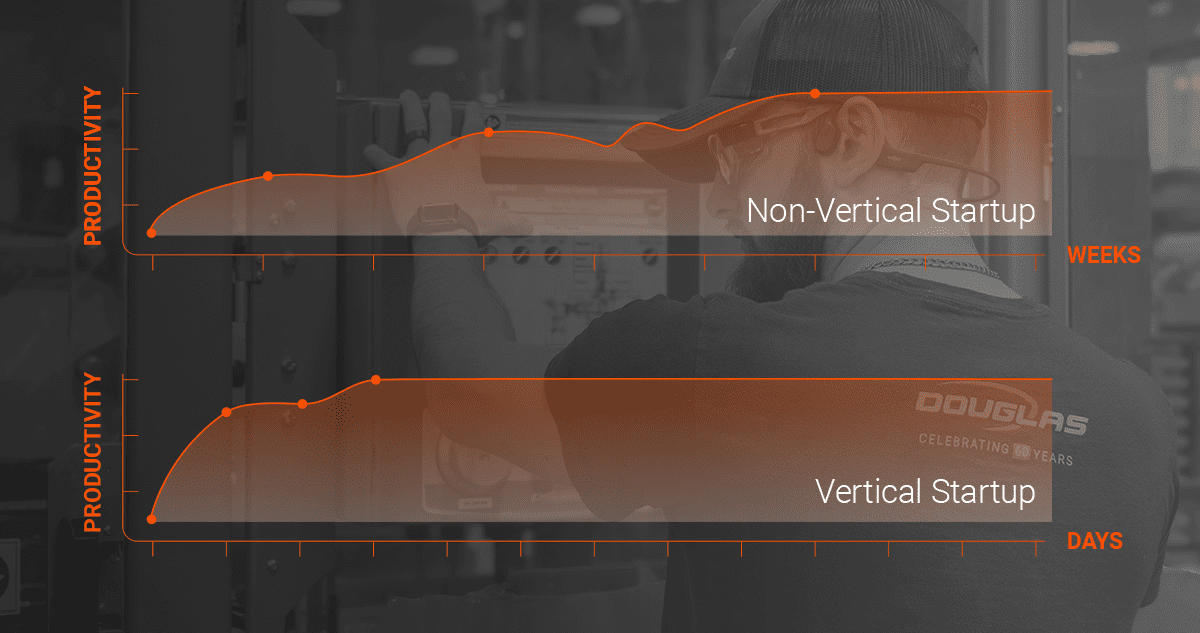
On a throughput-vs-time chart, the difference is visible. A vertical startup appears as a sharp rise to design performance and then a flat line. A poor startup appears as a low start that climbs slowly over weeks, with frequent dips as issues surface and are corrected. A well-prepared line hits that vertical rise within 24–72 hours whereas a typical unplanned line may take 4–12 weeks.
The difference between the two is the result of deliberate pre-startup readiness, involving Factory Acceptance Testing scope, operator training, documentation completeness, spares on-site, and commissioning governance. For operations leaders, understanding this distinction is essential. A line that achieves vertical startup recovers 6–10 weeks of productive capacity compared to a typical extended ramp, a material uplift during the critical ROI payback window.
What Vertical Startup Is (and Isn’t)
A line “goes live” on a specific day. The equipment is installed, utilities are connected, power is applied, and the first products roll off. That’s the event. It happens once, on one date.
Vertical startup is what happens after going live. It’s the speed at which the equipment reaches design performance.
Vertical startup is what happens after going live. It’s the speed at which the equipment reaches design performance, which includes nameplate throughput, target OEE (Overall Equipment Effectiveness), stable quality, and predictable changeovers. That outcome is measurable and continuous, and you can see it happening in real time on the production floor.
Some operations limit their focus to simply going live while others plan a strategy to achieve vertical startup. The difference between the two approaches is substantial. For example, with no advanced planning, a line could go live on Monday and still be operating at 40% of nameplate throughput on Friday. Or, with intentional efforts to achieve vertical startup, a line could go live on Monday and hit 95% OEE by Wednesday. Both lines succeeded in going live, but only one achieved the significantly better outcome.
The ramp curve below tells the full story. On a throughput-vs-time chart, a vertical startup appears as a sharp rise from zero to nameplate and then a flat line—approaching vertical, hence the name. A poorly planned startup appears as a slow, extended climb over weeks, with frequent dips as issues are discovered and corrected. The difference in the shape reflects the difference in readiness and execution.
 (Graphic) - Startup Graphs")
Consider this example of a 300-containers-per-minute filling line. A well-prepared startup reaches steady production of 280+ containers per minute by day two and hits 300 by day three, then stays there. A typical, unplanned startup might hit 150 containers per minute on week one, climb to 220 by week three, and finally reach 300 by week six—with multiple stoppages and adjustments along the way. While these lines share the same specifications, their different ramp ups show the drastic difference between achieving vertical startup and simply going live.
Why the Distinction Matters Financially
Extended startup windows are not cost-neutral delays. They compress the ROI payback window and represent lost productive capacity during a critical financial period.
OEE During the Ramp Phase
On a well-prepared vertical startup, the target is OEE >70% by the end of day one and >85% by the end of week one. On a poorly-prepared line, OEE may remain below 60% for 4–8 weeks. A line at 60% OEE instead of 85% loses 25 percentage points of productive capacity for weeks due to scrap, rework labor, and extended changeover times. Unfortunately, all these things accumulate on your balance sheet.
Changeover Performance During Early Operation
A well-prepared line achieves 20-minute stable changeover times by day two. A line without pre-startup testing may see 45+ minute changeovers during the first weeks. With a typical packaging line performing 10–15 changeovers per shift, the cumulative loss across the ramp window is substantial with hours of daily lost production.
The Payback Window
A well-executed vertical startup shortens the “time-to-stable-operation” window from 8–12 weeks down to 1–2 weeks. This effectively recovers 6–10 weeks of productive capacity during the ROI recovery window, which is a material uplift to your capital project’s economics during your primary success metric period.
What Separates a 3-Day Startup from a 10-Week Startup?
Whether you get a vertical startup or extended ramp is determined by five readiness factors before go-live.
1
Factory Acceptance Testing (FAT) Scope
A comprehensive FAT that replicates product and environmental conditions expected in production is significantly more predictive of startup success than a generic FAT. Generic FATs (testing equipment in isolation on OEM utilities) often miss integration issues and product-specific edge cases that emerge at the customer site. If FAT is generic, early-stage failures move from the OEM facility to your line.
2
Operator Training as a Continuous Process
One-off training events before go-live are insufficient to achieve vertical startup. Effective preparation includes comprehensive training that consolidates equipment manuals, controls documentation, and maintenance procedures into a single program, which is extended as a continuous process before and during early operation. Operators need to understand not just how to use an HMI, but the logic of the equipment and how to diagnose early issues.
3
Documentation Completeness
Complete, accessible equipment documentation before startup is a measurable readiness gate. The package should include P&IDs (Piping and Instrumentation Diagrams), electrical schematics, mechanical drawings, compliance certifications, software documentation, and emergency procedures. Missing documentation during startup creates operational friction where troubleshooting takes longer, workarounds multiply, and early issues snowball.
4
Spares and Wear Parts on Site Before Go-Live
Equipment enters production with known early wear and infant failures. Spare parts should be on site before startup to avoid downtime during the critical early operation phase. If a critical wear part fails on day two and the replacement is on back order, the line stalls, creating a preventable delay that extends the ramp window.
5
Sanitation and Changeover Procedures Tested Before Go-Live
Testing these procedures before startup—confirming that operators can execute stable changeovers, that cleaning procedures work as planned, that product transitions don’t create extended downtime—prevents this category of early issue. The changeover performance numbers (20 minutes vs. 45 minutes) exist because the procedures were validated beforehand.
How Vertical Startup Is Measured
Vertical startup is measurable against observable KPIs during the ramp phase, typically the first 1–4 weeks post go-live.
Time-to-nameplate throughput: A well-prepared line reaches design-rate production within 24–72 hours of going live while a typical line without vertical-startup readiness may take 4–12 weeks. The timeframe varies with product type and line complexity, but this range is commonly cited across industry sources.
OEE during ramp: Best-in-class manufacturers targeting vertical startup aim for OEE >70% by end of day 1, and >85% by end of week 1. Lines without vertical-startup preparation may spend 4–8 weeks below 60% OEE. This is the primary metric operations leaders use to evaluate startup health.
Changeover stability: A well-prepared line stabilizes on the first or second format changeover, meeting the 20-minute target by day two. A poorly-prepared line may require 3–4 changeovers before finding stable times, extending setup periods throughout the early weeks.
Reality Check: Isn’t “Vertical” Ambiguous?
There is no single published industry standard that defines “vertical” with precision. Some sources cite 3 days to nameplate, others cite 2 weeks. The variation reflects real differences in product type, line complexity, and integration scope.
With proper readiness, vertical startup is typically measured in days. Without proper readiness, this typically extends from weeks to months. The role of this evaluation is to equip you to build the readiness factors into your project from the start and measure the outcome in real time (vs finding a universal threshold).
Vertical Startup as an Emerging Contractual Practice
CPG companies and contract manufacturers are increasingly writing vertical-startup expectations explicitly into capital-equipment RFPs and acceptance criteria.
“For consumer packaged goods (CPG) companies, achieving vertical startups of packaging and processing equipment lines consistently and effectively are paramount.”
That quote reflects where the market is moving. Rather than accepting extended ramps as inevitable, sophisticated buyers are writing the expectation into the contract, making it a shared accountability between equipment supplier and end-user.
Emerging RFP best practices now include:
This evolution reflects industry maturation. The readiness factors described above are no longer mere recommendations but are becoming contractual obligations.
Conclusion
An extended startup window is the result of insufficient preparation, and insufficient preparation is visible from the outside when you know what to look for.
When you evaluate a capital equipment proposal, ask about the five readiness factors:
- Is the FAT scope comprehensive and product-specific?
- Is there a training plan that extends into early operation?
- Are documentation requirements specified in the contract?
- Will spares be on-site before go-live?
- Is there commissioning governance and post-startup support defined?
These questions tell you whether the project is architected for vertical startup or for extended ramp-up.
Vertical startup is becoming the expected baseline for capital equipment projects among leading CPG buyers. Operations leaders who understand the distinction between the event (going live) and the outcome (vertical startup), and who make vertical-startup readiness a requirement in their project planning and vendor selection, will position their organizations to recover the productive capacity that others leave on the table.
Want to Ensure Vertical Startup?
Give us a call. With 60+ years of experience, Douglas specialists can guide you through best practices that help you recover weeks of productive capacity during your payback window.